
Network monitoring
RUT200 monitoring with Zabbix: visibility for rural operations
How we combine an agent on the router, monitoring history and remote management to follow connectivity at fixed locations and on agricultural machinery.
The device is connected. But what is happening there?
In a rural operation, a router may be at a fixed site or travel with a machine in the field, far from the people providing support. When someone reports a problem, knowing only that the device appears online leaves several questions open. Is there traffic? Is the interface active? Is the processor busier than usual? Is the latest information recent?
This is the context in which Goalmoon worked on monitoring RUT200 routers with the Zabbix agent for a rural operation. RMS supports remote device management, while Zabbix organizes configured items, their history and alerts. Together, these capabilities provide a basis for investigating the environment beyond the report from someone on site.
From fixed locations to machinery in the field
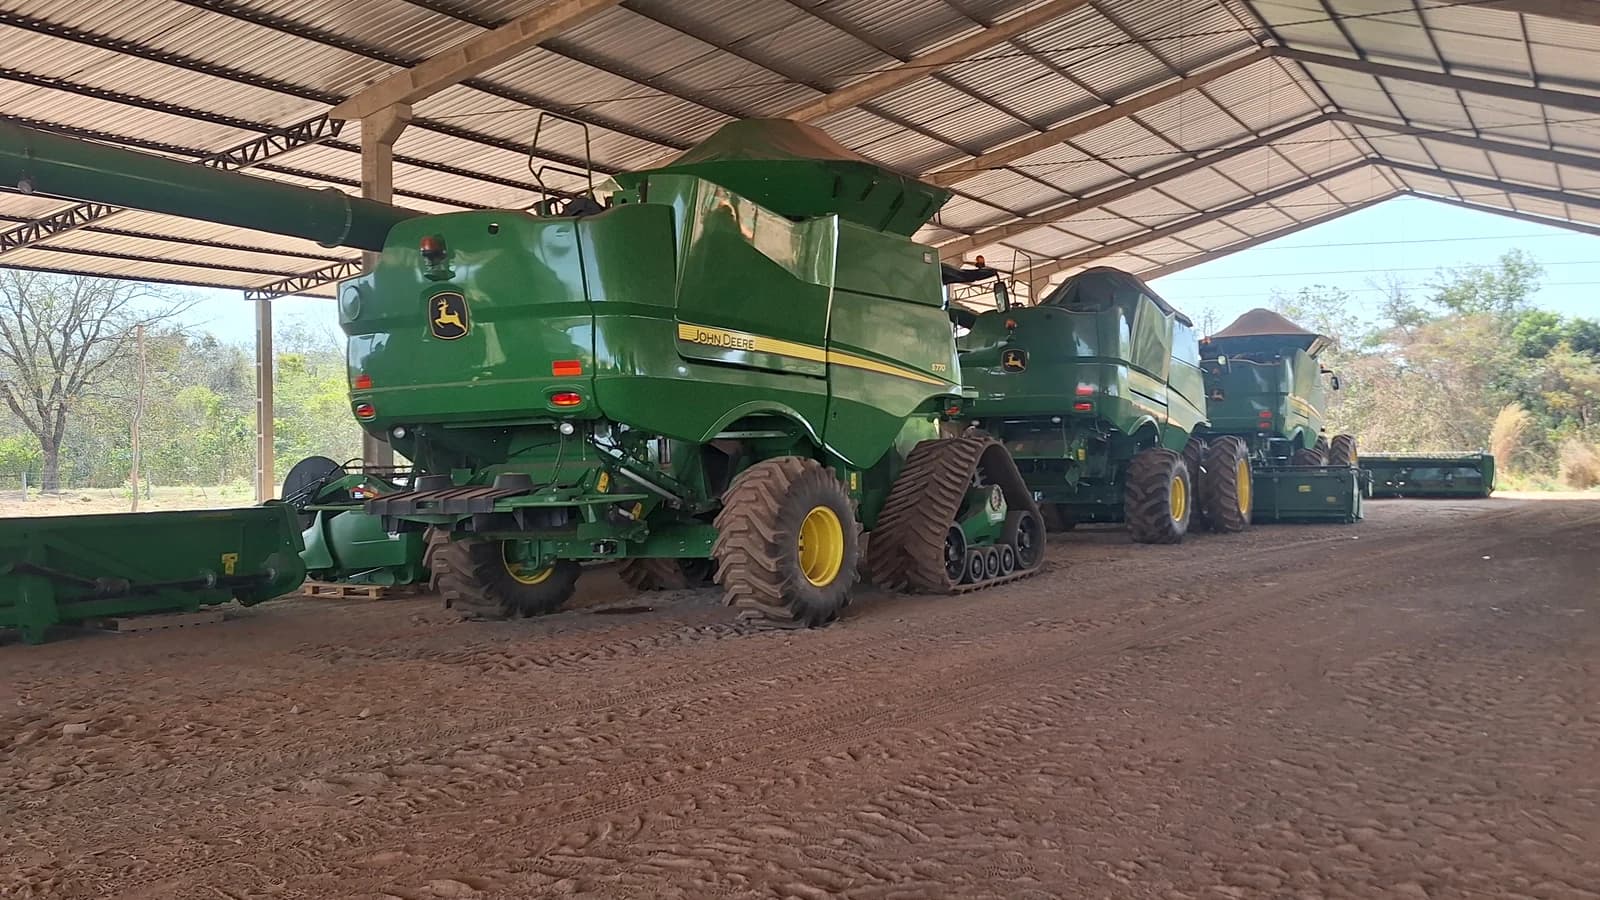
The project connects two parts of the same operation: fixed support areas, such as staff accommodation, and agricultural machinery. Models documented in the project include John Deere 6210J and 7230J tractors, John Deere S550 and S770 combines, Fendt 1046 Vario and 1050 tractors, and Stara Princesa TOP and Estrela planters. Their different roles need to be considered within the connectivity and support routine.
Where a RUT200 is monitored, the Zabbix agent collects data from the router supporting the connection. CPU usage, traffic and interface status help investigate communications infrastructure at fixed sites and on board agricultural machinery.
Across distributed locations, the same perception of slowness can have different explanations. Device connectivity, interface behavior and access to a service are related, but distinct, parts of an investigation. A view of the current state helps; a view of how it changes adds context.
Monitoring makes it possible to compare a reported issue with its timing and the available signals. Rather than starting from scratch every time, the team can ask more specific questions and decide what to check next. This supports remote diagnosis without turning a single indicator into an automatic conclusion.
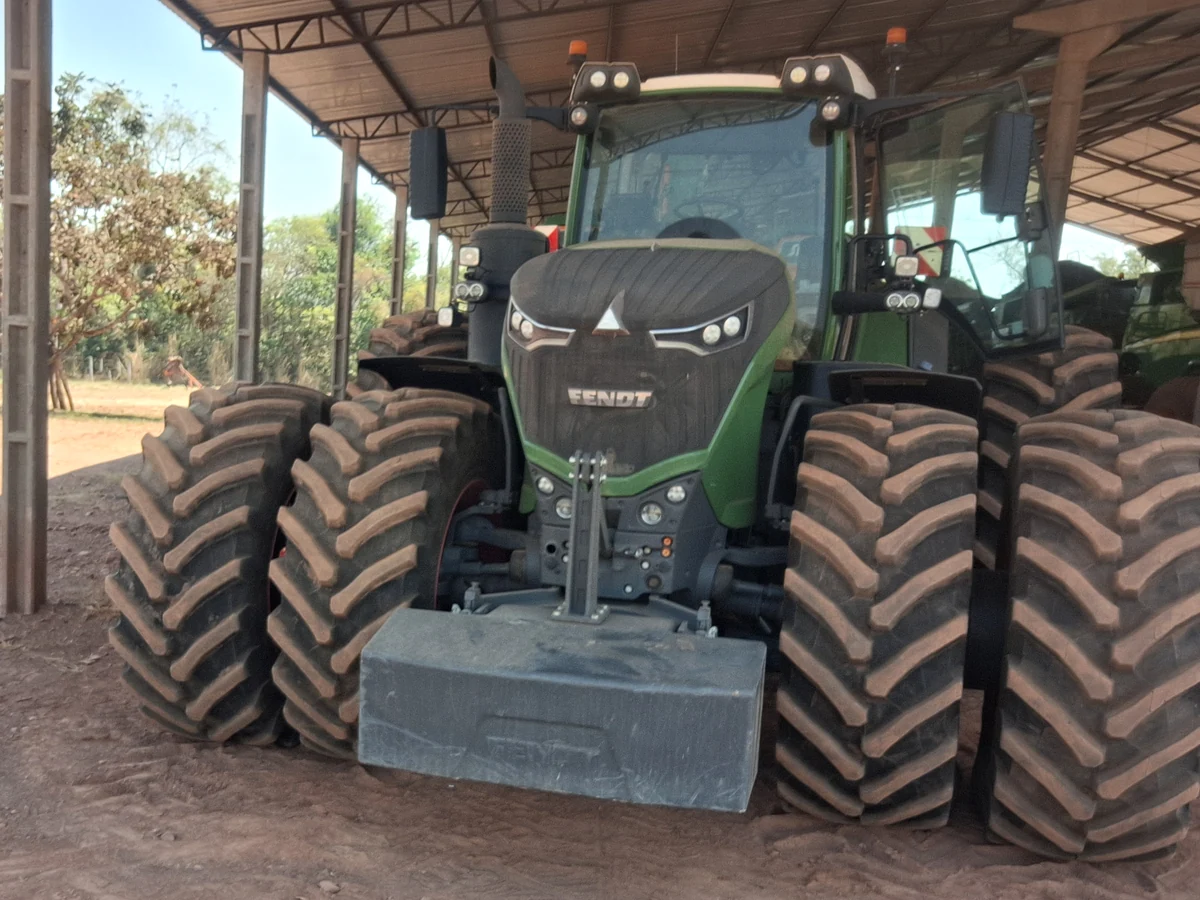
A Fendt tractor in the project environment. Connectivity support also follows the machinery.
View larger image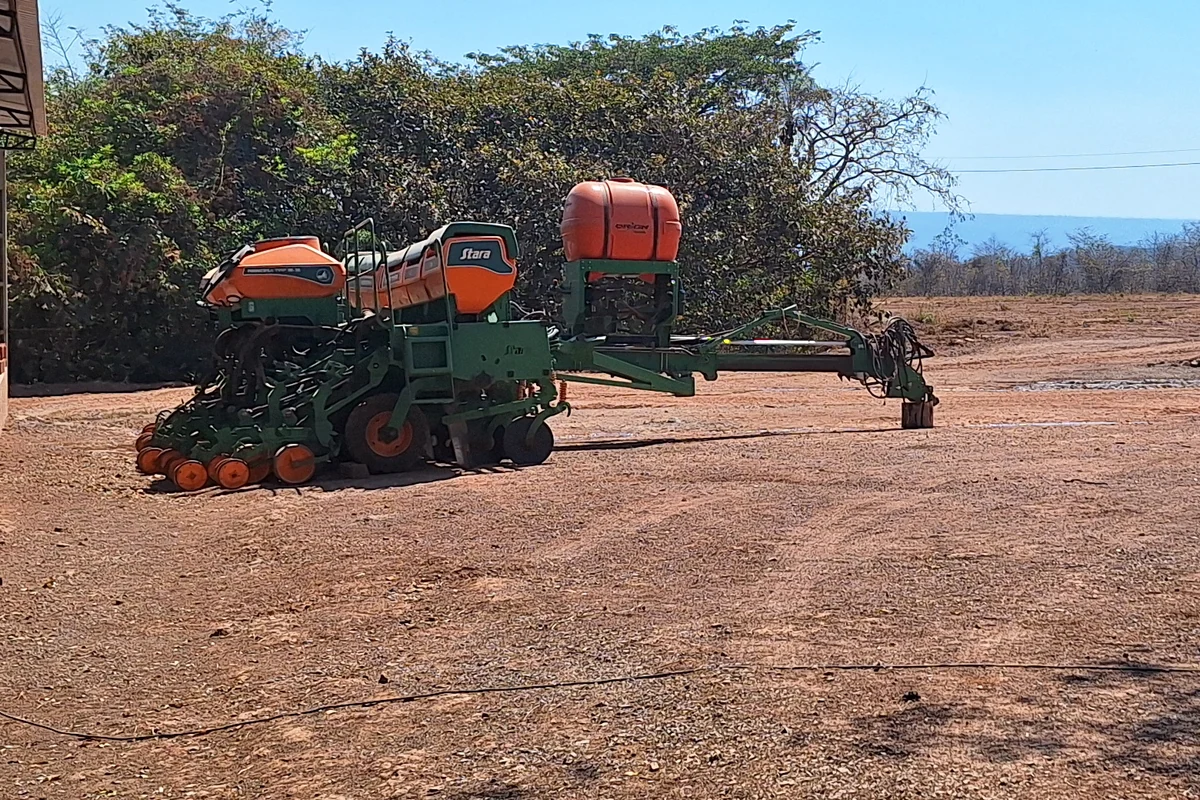
A Stara planter: communications infrastructure supports equipment with different roles.
View larger imageThe photographs and screens are actual project records. Dashboards have been cropped and identifiers anonymized, with the displayed data preserved.
RMS dashboard: device management

Actual RMS capture, with the list filtered to devices online at that moment. Names and identifiers have been anonymized. The overall summary retains the observed states; this snapshot does not represent historical availability.
View larger image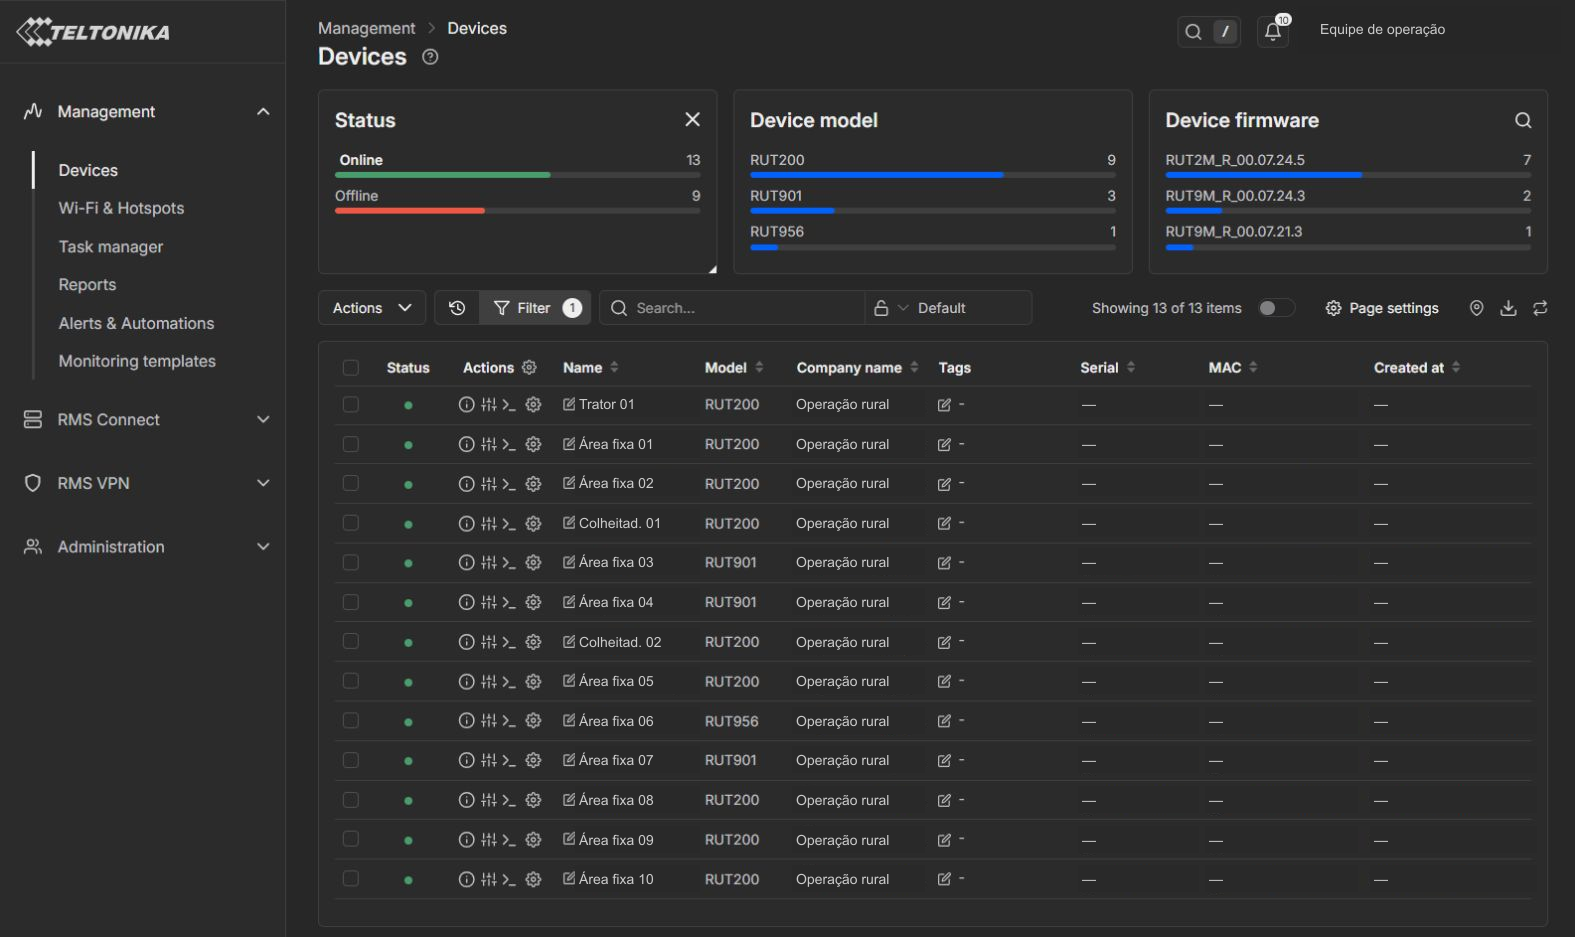
The agent brings data collection to the RUT200
The Zabbix agent is the component installed on the router to provide data for configured items. The Zabbix server is separate: it centralizes monitoring, keeps history and presents information for analysis. The RUT200 does not become the monitoring server.
This design makes it possible to observe the device through information collected on it. CPU and interface items are part of the scope monitored in this project. To be useful, each item needs an appropriate name, unit and collection interval for the operational question it should answer.
Installation also depends on the device. The model, system version, package availability and resources need to be checked before repeating this approach elsewhere. Teltonika documents monitoring through Zabbix, but its examples do not replace that device-specific assessment.
RMS and Zabbix play complementary roles
Remote management and monitoring help at different points in the work. It is useful to know which question belongs with each tool.
- RMS
Remote management and access
Helps teams keep track of devices and reach administration resources according to the access available. It is a management layer for working with the equipment.
- Zabbix
Items, history and alerts
Brings together configured monitoring data and makes it possible to follow changes over time. Interpretation depends on how current each item is and what it means.
Using both tools does not mean that RMS automatically sends data to Zabbix. Here, the agent on the router is part of monitoring data collection.

Conceptual architecture; network details omitted. Monitoring and remote management paths serve distinct purposes.
View larger image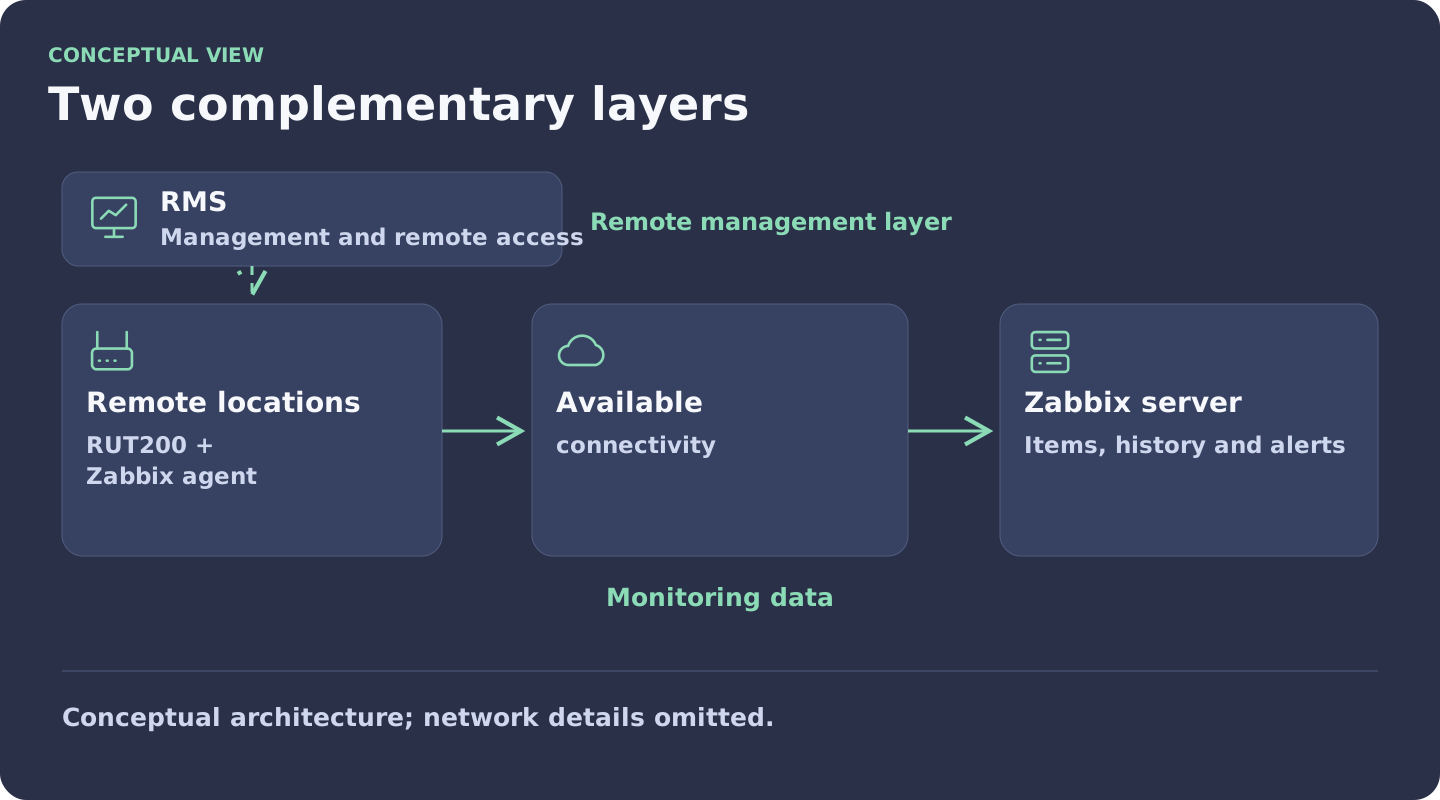
Every indicator should answer a question
A good-looking dashboard only helps the operation when its signals are understood. These are examples of useful readings for the items being monitored.
CPU usage
Has processor behavior changed?
History shows how usage varies during the period being observed. A spike can guide an investigation, but it does not identify the cause of a problem on its own. Timing and other available information matter.
Interface traffic
Is data being received and sent?
Receive and transmit series help reveal activity and changes in patterns. Values in Mbit/s represent observed traffic; they are not a measurement of the subscribed internet speed or the maximum capacity of the connection.
State, errors and discards
What is the interface reporting?
Operational state and error or discard counters help direct attention to an interface. Interpretation needs to account for the item and time period. An active interface alone does not prove that a remote service is reachable.
Data freshness
Are we looking at current or old information?
Before interpreting a value, check when it was updated. A normal last value may remain visible after collection has stopped. The timestamp is part of the information the team needs to assess.
Zabbix dashboard: router history

Actual Zabbix capture covering a one-hour window. Charts and values are preserved; only the device identifier has been anonymized.
View larger image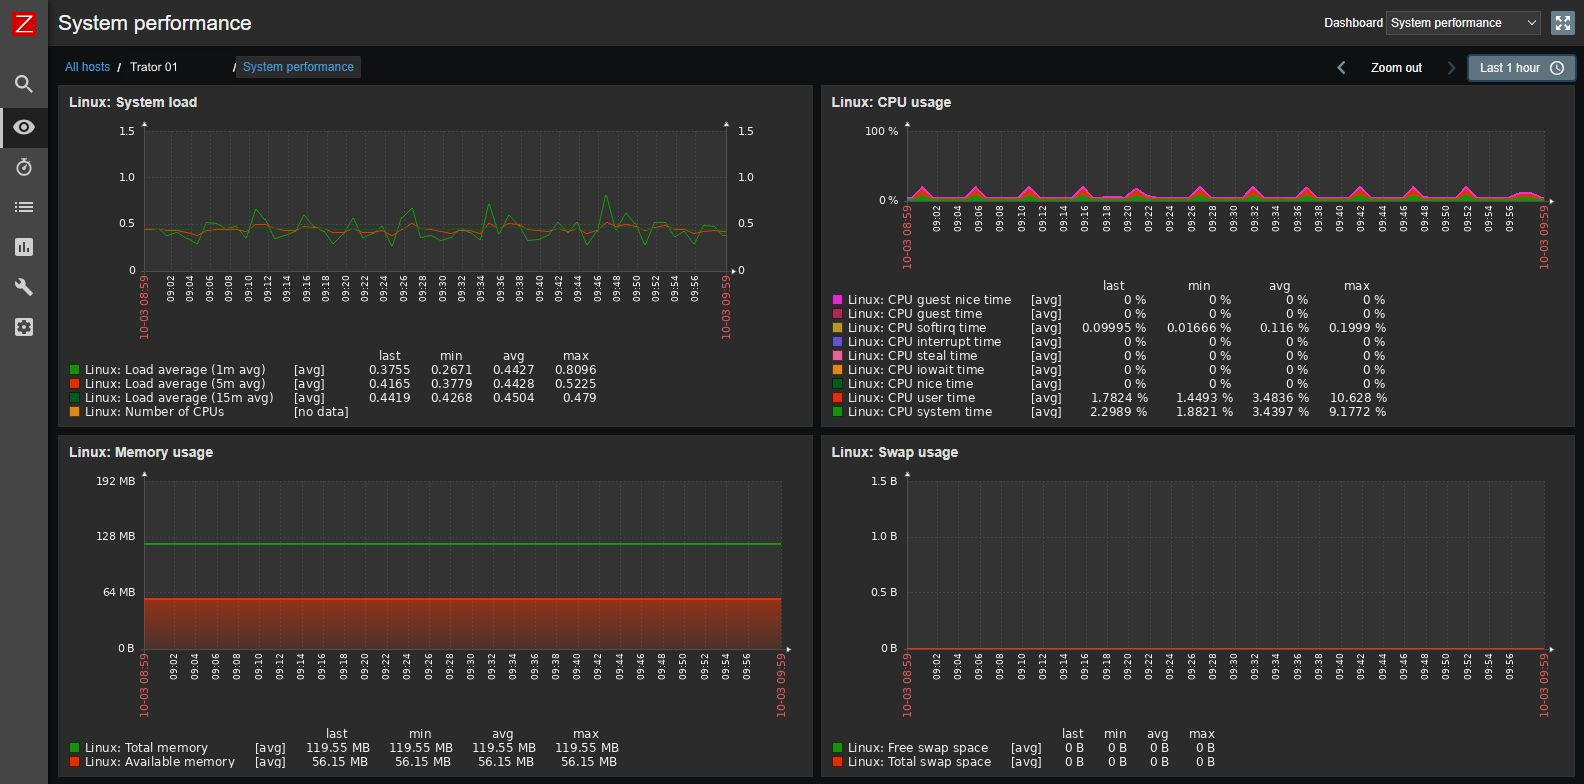
An alert starts the investigation
When an alert appears, the initial reading should consider what triggered it, when it happened and whether data is still arriving. The team can then compare item history with other available information and check the access paths to the device. This sequence helps separate symptoms, context and hypotheses.
A device appearing online in RMS does not guarantee that its agent is supplying current data to Zabbix. Equally, missing data does not prove that the router is faulty. The device, communication and monitoring need to be examined in context.
The value lies in guiding the next check. Monitoring does not remove the need for technical analysis or resolve every event by itself; it gives the team information to ask better questions and record what it finds.
Connecting implementation to day-to-day operations
For this project, Goalmoon brought the Zabbix agent to the RUT200 routers and worked with their supervision in the monitoring environment. Remote management through RMS and interpreting the data in Zabbix are part of that infrastructure work.
For a new deployment, putting data on a screen is only part of the service. The team also needs to decide what to follow, how to interpret the signals and who will act when an event occurs. Documenting these criteria supports continuity and avoids relying only on the memory of the person who configured the environment.
Start by understanding your operation
A monitoring proposal starts with the actual environment: which devices are in use, where the connection points are, what access is available and which difficulties need investigation. The choice of items and alerts should follow those needs.
That conversation provides a starting point for assessing monitoring deployment and integration, access requirements and the follow-up routine. The aim is visibility that the team can use in daily work, with a diagnostic process suited to the operation.
Questions about monitoring
Does the Zabbix agent replace RMS?
No. The agent participates in collecting monitoring items. RMS provides remote management and access capabilities. These different roles can complement each other.
Does an online router mean everything is working?
Not necessarily. Device presence, data freshness and access to the services used by the operation are distinct things to check.
Does installation work on every system version?
Package compatibility and device resources need to be checked for the model and version in use. A documentation example does not guarantee installation in every environment.
Can Goalmoon assess monitoring for my network?
Yes. Tell us how your operation is distributed and what difficulty you want to monitor. That conversation helps define an appropriate deployment and integration scope.